
Analyzing your citizen science data
Completed your survey and keen on looking deeper into your data? Here are some ways to analyze your data collected!
Last updated 18 May 2026
Making sense of your data
To better understand your biodiversity data collected, you can look at abundance, richness and diversity of the species encountered in your survey.
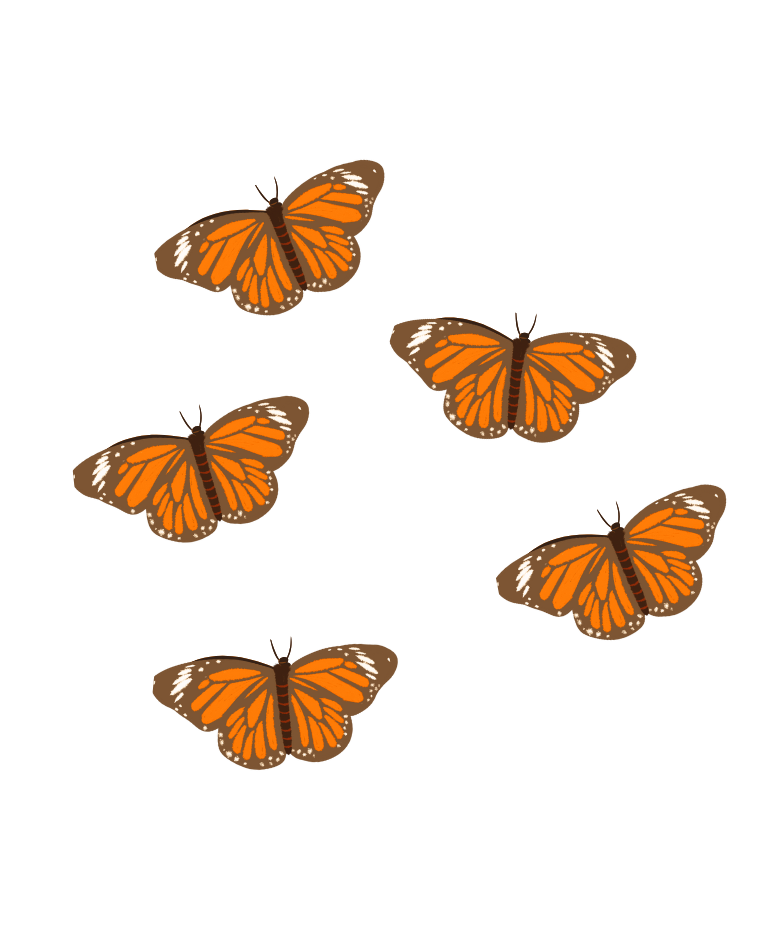
Abundance
Abundance refers to the number of living things, such as animals, plants, fungi, or any other group, that are present in a particular area. If you count 15 butterflies during your survey, then the abundance of butterflies in that garden at that point of time is 15.
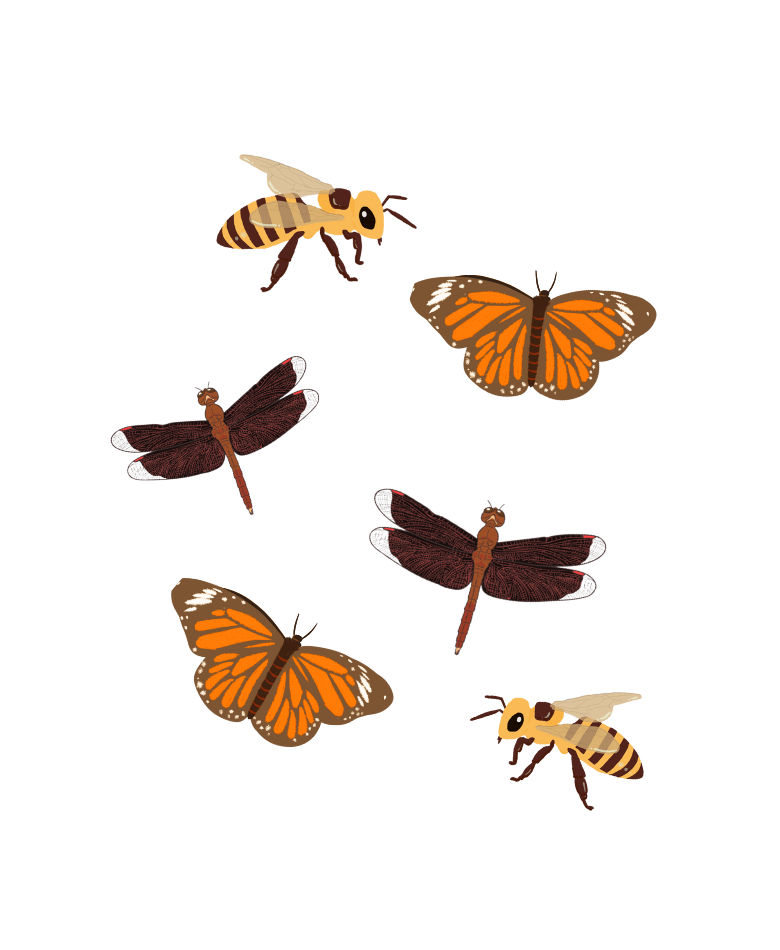
Richness
Richness is about the number of different kinds of living things (species) in an area or habitat. If abundance tells us ”how many [individuals]”, richness tells us ”how many different species”. During your survey, if you see many species of butterflies, bees and dragonflies in the garden, the garden has high species richness. If you see only one or two species of butterfly, the garden has low species richness.
Diversity
In biodiversity studies, diversity is not only about how many different species there are in a habitat; it measures how balanced their populations are. Diversity takes into account both the number of species (richness) and the number of individuals of each species (abundance). A truly diverse ecosystem has many different species of relatively similar number of individuals – no one species is dominating the landscape.
Collating your findings
After your analysis, collate the findings and come up with a simple event report. Here’s what you can include in the report:
Most common species
Rarest or any notable species observed
Total number of species observed
Distribution of species observed
Population Trends (if any)
You can even do further research and present your findings through posters! This will reinforce what you have learnt and you may even discover more about our native species.
Now that you've analysed your data, let's learn how to properly visualise your findings!